About Me

My photo
Mumbai, Maharastra, India
He has more than 7.6 years of experience in the software development. He has spent most of the times in web/desktop application development. He has sound knowledge in various database concepts. You can reach him at viki.keshari@gmail.com https://www.linkedin.com/in/vikrammahapatra/ https://twitter.com/VikramMahapatra http://www.facebook.com/viki.keshari

Search This Blog

Thursday, July 18, 2019

Tableau Filter 3: Establishing relationship between filter column


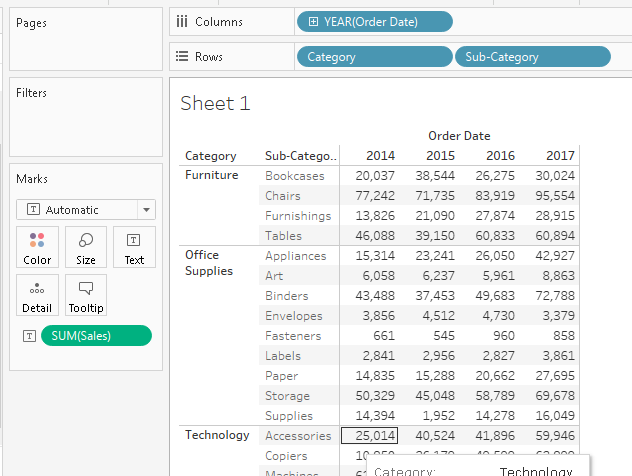
What we are trying to achieve is that, if we have two filter like Category and Sub-Category, on selecting category, the associated sub-category should get populated in the subcategory filter list..


Here if you see in above picture right vertical panel, I have selected Category as “Furniture” and under Furniture we have only four sub category but in filter we can see it list out all sub category.

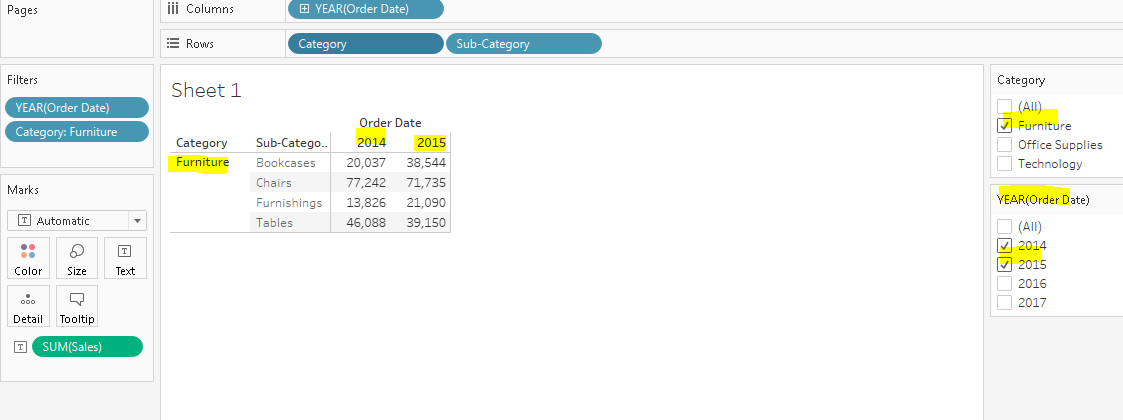
So what exactly we want is when user selects furniture in filter only those subcategory which belongs to Furniture should get displayed in subcategory filter.


Go to Sub-Category Filter à Click on Only Relevant value, here in below figure you can see only Sub-Category are now refined to show only those sub category which belongs to Furniture.


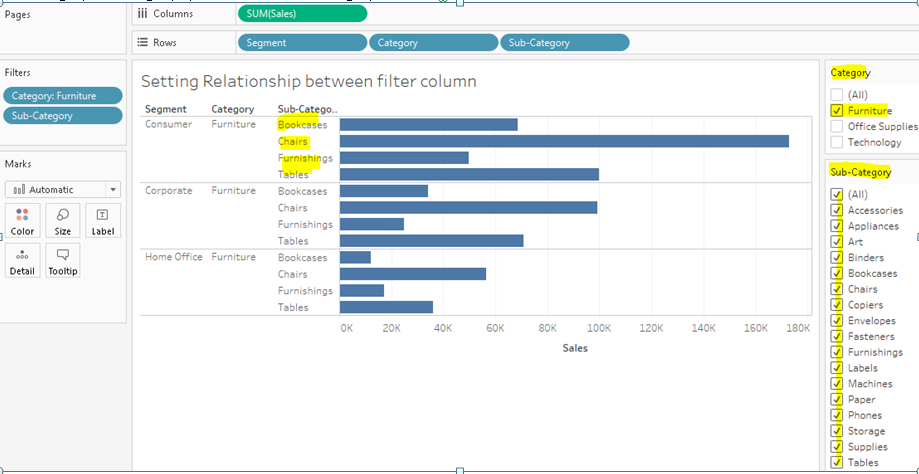
Same way on selecting Category as Office Supplies, Sub-Category filter shows only those items which belongs to Office Supplies.


Enjy Tableau J
Post Reference: Vikram Aristocratic Elfin Share

Wednesday, July 17, 2019

Tableau: Applying Filter and Color combination to your dataset-II

Prev Post:


Lets talk about Interactive filter, here you can select at runtime which subset of data you want to see, let’s take an example from the Superstore dataset, where we want to see all order made in a particular year same want we also want to get subset of selected sub category


From the above set, I am interested in selecting subset of data say 2014, 2015 and category I am interested is Furniture and office supplies

So what you need to do is to
Go to the column “Year”à RClick go to Show Filter à Filter selection will come in right panel with value to select at runtime, same way you need to
Go to category à Rclick go to Show Filter à Filter selection will come in right panel with value to select at runtime


So now here from right side filter panel, you can select year as well as category you want to see the data, lets select 2014 and 2015 as year and category as Furniture


In next post we will see how to establish relationship with two or more filter column..


Enjy Tableau J
Post Reference: Vikram Aristocratic Elfin Share

Monday, July 15, 2019

Tableau: Applying Filter and Color combination to your dataset-I


Tableau provide different kind of filter
1)       Filter Shelf
2)       Interactive filter

Filter Shelf: Continuing with the Superstore dataset, if we want to filter number of sales on the basis of OrderDate, then just drag orderDate from Dimension to Filter panel, the moment you drag the column to filter panel, a dialog box will appear like below which ask for which year you want to extract the number of sales, in this example we have taken 2016 and 2017 years in filter to see the sales made. Just select the years you want to see and click ok.


After applying filter, we have filtered sales number just for 2016 and 2017 year


Now if you want to see all only these category where sales number are greater than 50,000, in that case drag the sales from Measure and put it to Filter Panel, once you drop the sales measure to filter panel, a dialog box will appear where you can select
·          At Least
·          At Most
·          Range
·          Special; which is used to filter NULL values

In our case lets select At Most tab and keep the value as 50,000, because we are interested to see all category where sales made are more than 50,000


Once you apply above filter your data is filter to show only those category where sales made are greater than 50,000.


Enjy Tableau J
Post Reference: Vikram Aristocratic Elfin Share

Sunday, July 14, 2019

Tableau: Creating Hierarchies and drill down

Tableau provide functionality to drill down from highest level to lowest level of granularity, with the help of + and – symbol in the report column.

I am taking superstore dataset for this example which is free dataset to be used for analysis.

Creating Hierarchies

Here below if we see, I have taken Segment|Category|Sub-Category as a row granularity over which I am trying to find number of sales made under each granularity.


What if, I want see how many sales made each year under consumer segment and then drill down to see consumer-furniture thereafter consumer-furniture-chairs..

To fulfill this kind of requirement, Tableau reporting has provided column hierarchy. Let’s see how to form hierarchy
Go to Column à RClick à Create Hierarchy


Once the hierarchy is created go to column which you want to add to the hierarchy à RClick à Hierarchy à add to existing hierarchy. In below example you can see Hierarchy is created with name “Segment-Cat-SubCat” and three columns are added to the hierarchy i.e. segment, category and sub category.


Also in above figure you can see in Rows, the segment comes with + prefix, which means if has further drill down.
In below figure if you click on +Segment à it will break into Segment and +Category


Same way if you click on +Category à it will break into Category and Sub-Category as show in below figure


Enjy Tableau J
Post Reference: Vikram Aristocratic Elfin Share